Capital Markets Memorandum 002
Capital Markets Memorandum 002
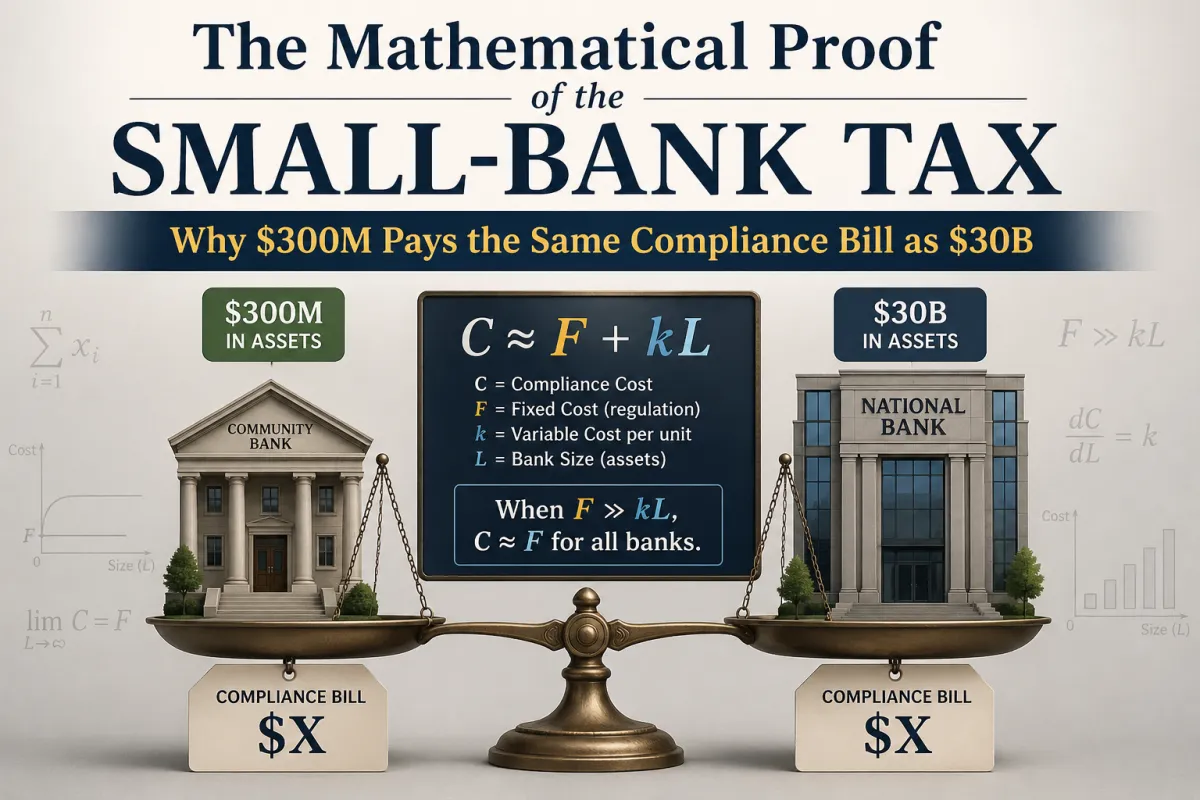
The Mathematical Proof of the Small-Bank Tax: Why $300M Pays the Same Compliance Bill as $30B
Architectural Brief No. 004 is named the Small-Bank Tax. It described, in structural terms, the cumulative burden that fixed costs impose on institutions without scale — the compliance bill that does not shrink when the balance sheet does, the technology infrastructure that charges near-identical fees regardless of asset size, the regulatory examination posture that treats a $300 million bank and a $30 billion bank as peers in obligation but not in capacity to absorb cost. Brief No. 004 named the problem. This Memorandum proves it numerically.
The proof has three parts: what the cost data actually shows, what happens when you model the cost differential in a direct simulation, and why the consequence is not a profitability gap but a structural trap — one from which the only durable exits are scale through consolidation or capital velocity through securitization.
The Nature of Fixed Costs in Banking
The first analytical point is definitional: the core operating costs of a regulated depository institution do not scale linearly with asset size. They are, in the language of cost accounting, predominantly fixed — they are incurred whether the institution holds $100 million in assets or $100 billion, and they change in meaningful ways only at large multiples of asset growth.
These fixed cost categories include:
Core banking platform licenses: Software fees for deposit processing, loan origination, transaction reconciliation, and regulatory reporting are structured with volume-adjusted components — but the floor pricing for an FDIC-supervised institution's core system is effectively fixed. A $200 million bank and a $2 billion bank may pay fees that differ by a factor of three; their asset bases differ by a factor of ten.
BSA/AML compliance infrastructure: Bank Secrecy Act and Anti-Money Laundering programs require dedicated personnel, transaction monitoring software, suspicious activity report filing systems, and ongoing third-party audits — regardless of the volume of transactions the institution processes.
Annual external audit: FDIC-supervised institutions above $500 million in assets are required to undergo annual independent audits meeting standards set under Part 363 of FDIC regulations. Below that threshold, the requirement is not mandated by the same rule but is expected by examiners and demanded by any serious counterparty. The fixed cost of an external audit from a reputable firm does not scale proportionally with asset size.
Cybersecurity infrastructure: Federal banking regulators' cybersecurity guidance — including FFIEC standards and the FDIC's examination criteria — requires formal information security programs, penetration testing, vulnerability assessments, third-party vendor risk management, and incident response planning. These are institutional requirements, not volume requirements.
CRA program management: A dedicated Community Reinvestment Act program — assessment area analysis, qualified investment tracking, public file maintenance, examination preparation — is a regulatory obligation for every FDIC-insured depository institution, irrespective of size.
Regulatory examination preparation: Federal and state examination cycles require management time, documentation preparation, and often outside legal counsel. The hours required to prepare for an examination do not halve when the balance sheet halves.
Each of these line items represents an infrastructure cost that is incurred at the category level, not the transaction level. The bank that originates $50 million in loans per year and the bank that originates $5 billion face largely the same categorical obligations.
The Small-Bank Tax is not what banks pay more of. It is what they pay proportionally more of — the same bill, divided by a smaller denominator.
What the Data Shows
The Conference of State Bank Supervisors publishes the most comprehensive longitudinal analysis of compliance costs across institution sizes. Its 2025 report, covering ten years of survey data from 2015 through 2024, documents the gap with precision.
Smallest banks — those at the bottom of the asset-size distribution — spend 11 to 15.5 percent of their total payroll on compliance tasks, compared to 6 to 10 percent at larger institutions. This gap held consistently across the entire decade of the survey period. It did not narrow. It did not compress. It held.
Accounting and auditing expenses devoted to compliance functions showed an even sharper differential: smaller institutions spent 5 to 17 percentage points more of their data processing and audit budgets on compliance-specific tasks than larger peers. The CSBS researchers attribute this pattern explicitly to the economics of fixed overhead — post-financial crisis regulatory requirements raised compliance costs across the industry, but large banks could spread those fixed costs across vastly larger asset bases, while community banks could not.
Earlier Federal Reserve Bank of St. Louis research, based on CSBS survey methodology, found that banks under $100 million in assets were spending nearly10 percent of noninterest expense on regulatory compliance alone, versus approximately 5 percent at banks in the $1 billion-to-$10 billion range. A 2x compliance cost burden at the noninterest expense line — before credit losses, before margin compression, before capital deployment inefficiency.
This is the quantitative baseline. What follows is the simulation that makes the ratio real.
The Direct Cost Simulation
Two institutions. Both FDIC-insured. Both community-focused. Both are operating in metropolitan markets with real credit demand. Different only in size.
Bank A: A $500 million MDI. Representative of the larger Black-owned banks — institutions like Citizens Trust Bank ($769 million), First Independence Bank ($665 million), Industrial Bank ($748 million), or Carver Federal Savings Bank ($752 million), all of which operate in the median-to-upper range of the MDI asset distribution.
Bank B: A $30 billion regional bank. A mid-tier institution by contemporary banking standards — comparable to a United Bankers' Bank or a Glacier Bancorp before major acquisitions. Not a money-center bank. A serious regional competitor.
The Annual Compliance Infrastructure Stack

As a percentage of total assets:
Bank A: $12.1M ÷ $500M =2.42 percent of assets
Bank B: $59.5M ÷ $30,000M =0.20 percent of assets
The $500 million MDI pays 12.1 times more per dollar of assets for the same categorical compliance infrastructure as the $30 billion regional bank.
These figures are consistent with the CSBS longitudinal data. They are not constructed to dramatize. They are the cost structure of regulated banking applied to two institutions whose asset bases differ by a factor of 60.
What It Means at the Income Statement Level
A $500 million MDI generating a 3.5 percent net interest margin produces approximately $17.5 million in net interest income on a fully deployed balance sheet. Against that, $12.1 million in compliance infrastructure costs represents a 69 percent charge against net interest income before provisions, before technology, before personnel costs outside compliance.
The $30 billion regional bank generating the same 3.5 percent NIM produces approximately $1.05 billion in net interest income. Against that, $59.5 million in compliance infrastructure costs represents a 5.7 percent charge against net interest income.
Same compliance obligation. Different denominators.
The MDI is not mismanaged. It is not underdisciplined in its cost control. It is simply operating a fixed-cost infrastructure on a balance sheet that is too small to amortize it efficiently, because no individual MDI has the origination volume to justify the balance sheet that would make the ratio tolerable.
The Capital Trap
The compliance cost problem is compounded by a second structural constraint that operates simultaneously and independently: the capital trap— the mechanism by which every successful loan an MDI makes limits its ability to make the next one.
Under current community bank capital frameworks, institutions must hold approximately 8 to 10 percent of risk-weighted assets in regulatory capital. For a $500 million bank with a typical risk asset profile, that means approximately $40 to $50 million in required capital locked against the existing loan book.
When that capital is committed, lending stops — regardless of the credit demand in the community.
Concentration limits impose a second ceiling. Federal banking regulations limit loans to any single borrower to 15 percent of unimpaired capital and surplus (Section 84 of the National Bank Act; state-chartered equivalents track closely). For a $500 million bank with $50 million in capital, the single-borrower limit is $7.5 million. This is a material constraint in commercial real estate markets where individual project financing routinely requires $10-to-$20 million — or more — in credit.
The consequence is a structural ceiling on deal size, not on credit quality. The MDI may have a creditworthy borrower, a well-underwritten project, and strong community demand. It may still be unable to participate, because the loan exceeds its legal lending limit. Larger banks can book these loans alone or lead a participation. The MDI is structurally excluded from a segment of the credit market that its community actively needs.
Bank B — the $30 billion regional — has a single-borrower limit of approximately $450 million. It does not face a meaningful ceiling at the project sizes common in urban commercial real estate. The entire category of complex, middle-market credit is available to it.
The capital trap and the compliance cost burden operate on the same bank simultaneously. High compliance costs depress net income. Lower net income means slower retained earnings growth. Slower capital growth means the lending ceiling rises slowly, if at all. A bank that cannot grow its capital cannot meaningfully expand its balance sheet. A bank that cannot expand its balance sheet is paying the same fixed compliance infrastructure cost on a denominator that refuses to grow.
This is the compounding mechanism. It does not require the bank to make a strategic error. It is the consequence of being the right size for the wrong cost structure.
The MDI Landscape: Performance Under Structural Constraint
This analysis should not be mistaken for a criticism of MDI management quality.
As of Q3 2024, the 150 FDIC-insured MDIs held over $360 billion in combined assets, with total loans growing $13.3 billion (5.7 percent) year-over-year. Pretax ROA at MDIs ran 1.59 percent — 38 basis points above the community bank peer ratio of 1.21 percent. The FDIC's Q4 2025 Quarterly Banking Profile shows full-year industry ROA at 1.20 percent; community banks at 1.32 percent pretax ROA. MDI institutions are running at or above those benchmarks.
According to Investopedia's analysis, there are currently 23 Black-owned FDIC-insured banks within the ~148-150 MDI universe, representing a narrow subset of total MDI assets — institutions that have survived multiple economic cycles, regulatory tightening, and persistent undercapitalization while maintaining credit quality that meets or exceeds industry norms.
The point is not that these banks are failing. The point is that they are performing well — and still trapped.
Performing well under structural constraint is not the same as performing freely. A bank earning 1.59 percent pretax ROA while paying 2.42 percent of assets in compliance infrastructure is generating returns despite the cost structure, not because of it. The question is not whether MDIs can survive the Small-Bank Tax. Most of them can. The question is whether surviving it is a sufficient ambition for institutions that are supposed to be the primary credit infrastructure for underserved communities.
It is not.
The Only Exits
The Small-Bank Tax is a structural problem. Structural problems have structural solutions.
Exit 1: Grow the balance sheet organically. If the denominator of the compliance cost ratio grows — if the $500 million MDI becomes a $2 billion MDI through deposit growth, retained earnings, and loan expansion — the per-dollar cost of the fixed compliance infrastructure falls materially. A $2 billion MDI paying $14 million in compliance costs is at 0.70 percent of assets. The tax diminishes.
The problem: organic balance sheet growth at MDI scale, in underserved deposit markets, is a decade-plus process. The deposit ceiling — the structural constraint that limits MDI deposit growth to the savings capacity of communities that have themselves been systematically undercapitalized — means that organic growth, without a capital recycling mechanism, is slow enough to be non-competitive. The tax continues to compound while the institution grows.
Exit 2: Consolidate. Two $500 million MDIs combining into a $1 billion institution halves the per-dollar compliance cost burden. The fixed infrastructure is now amortized across a doubled asset base. Architectural Brief No. 004identified consolidation as a structural necessity for the MDI sector, not a surrender. It is mathematically correct.
The problem: consolidation requires governance alignment, shareholder agreement, and regulatory approval across institutions that may have different community mandates, different ownership structures, and decades of independent identity. It is viable — and some MDIs should pursue it — but it is not fast, and it is not universal.
Exit 3: Move assets off the balance sheet through securitization.If the denominator cannot grow fast enough through deposits alone, the numerator can be kept productive. A $500 million MDI that sells $50 million in eligible loans into a multi-originator SPV each year, recovers that capital in weeks rather than decades, and redeploys it into new originations — that institution is effectively operating a lending capacity that exceeds its balance sheet. It is generating origination fee income, servicing fee income, and community credit deployment from a capital base it never actually fully deploys into static hold-to-maturity positions.
This is the exit that Memorandum 001 documented the market for. The $824.5 billion Rule 144A ABS market is the mechanism. The multi-originator SPV is the access point.
The Small-Bank Tax will not be abolished by regulatory advocacy or by community loyalty campaigns. It will be escaped by institutions that build the infrastructure that makes the denominator grow faster than the fixed cost structure can consume it.
The Conclusion the Data Requires
The Small-Bank Tax is not an accident.
It is the mathematical consequence of applying a fixed-cost regulatory infrastructure to balance sheets that were never allowed to grow to the size at which those fixed costs amortize efficiently. That undercapitalization was not accidental either — it is the cumulative product of credit discrimination, deposit-based concentration in underserved communities, and four decades of exclusion from the capital markets infrastructure that would have allowed MDIs to recycle capital at the speed of institutional banking.
The solution requires acknowledging what the problem actually is.
It is not insufficient community support. It is not inadequate management.
It is an infrastructure gap — the absence of the originate-to-distribute mechanism that large banks have used for forty years to escape the constraints that the Small-Bank Tax imposes on every institution operating below the scale threshold.
Memorandum 001 documented the market that makes escaping this trap structurally possible. This Memorandum has proven numerically why escaping it is not optional.
Memorandum 003 names the leadership consequence of everything documented in this series so far.
What's next at Keystone
Memorandum 003, published May 26, examines April 10, 2019 — the day seven bank CEOs sat before the House Financial Services Committee and predicted, by unanimous silence, that banking's future leadership would look exactly like its present. The argument is structural: the succession pipeline runs through the capital markets infrastructure that MDIs cannot yet access — and the cost documented in this Memorandum is one reason why. To engage with this work — bank operators seeking dialogue, capital stewards seeking proximity, researchers seeking critique — contact [email protected].
